One of the most popular applications of the canvas element in HTML5 is graphing data. In the first part of this multipart series we will start with a very simple example of how to plot data on a graph that is drawn on a canvas element. Then we can build on these basic concepts to make our graph more functional and flexible.
This example is coded for readability and not for optimized operation. All you need is a text editor like notepad and an HTML5 friendly browser (I’m using Firefox 3.6).
<!doctype html>
<html>
<head>
<meta charset="UTF-8" />
<title>Canvas Test</title>
</head>
<body>
<section>
<div>
<canvas id="canvas" width="180" height="105">
This text is displayed if your browser
does not support HTML5 Canvas.
</canvas>
</div>

<script type="text/javascript">
var canvas;
var ctx;
var j;
var x = 0;
var y = 105;
var WIDTH = 180;
var HEIGHT = 105;
var temps = [80,95,85,78,92,95,79];

function drawaxes(){
ctx.strokeStyle = "black";
/* y axis along the left edge of the canvas*/
ctx.beginPath();
ctx.moveTo(0,0);
ctx.lineTo(0,105);
ctx.stroke();
/* x axis along the bottom edge of the canvas*/
ctx.moveTo(0,105);
ctx.lineTo(180,105);
ctx.stroke();
}

function clear() {
ctx.clearRect(0, 0, WIDTH, HEIGHT);
}

function init() {
canvas = document.getElementById("canvas");
ctx = canvas.getContext("2d");
draw();
}

function plotdata(){
ctx.strokeStyle = "black";
ctx.beginPath();
ctx.moveTo(0,HEIGHT-(temps[0]));
j = 1;
for (var i in temps){
ctx.lineTo(j*30,HEIGHT-(temps[j]));
ctx.stroke();
j++;
}
}

function draw() {
clear();
drawaxes();
plotdata();
}

init();
</script>

</section>
</body>
</html>
You can copy this code and paste it into a new file called something like simplegraph.html and when you open it with an HTML5 friendly browser like Firefox 3.6 it will display the graph.
Here is how we will make our simple graph.
create 2d canvas context
draw x axis
draw y axis
draw path based on data
Our data will be 7 days of high temperatures.
| Day | Temperature |
| 1 | 80 |
| 2 | 95 |
| 3 | 75 |
| 4 | 78 |
| 5 | 92 |
| 6 | 95 |
| 7 | 79 |
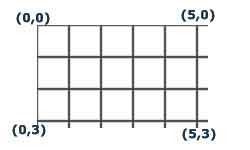
We need to understand how to plot points onto a canvas element.
The x axis starts at 0 on the left and increases as you move to the right and the y axis starts at 0 at the top and increases as you move down.
Let’s put a canvas on our page
<canvas id="canvas" width="180" height="105">
This text is displayed if your browser does not support HTML5 Canvas.
</canvas>
To draw on our canvas we need to get a javascript reference to the canvas element. We do this in our init() function which is the function that we call to start everything.
function init() {
  canvas = document.getElementById("canvas");
  ctx = canvas.getContext("2d");
  draw();
}
First we get the element ID from the DOM for the canvas element with the id = “canvas” and then we get an object in the form of a context of our canvas allowing us to do stuff with it in javascript.
This context contains the basic methods for drawing on the canvas such as arc(), lineto() and stroke().
The next line calls our draw() function
The draw() function will draw our graph.
function draw() {
  clear();
  drawaxes();
  plotdata();
}
We call our clear() function which uses the clearRect() method to erase everything in a rectangle that is the same size as the canvas. Two opposite corners of the rectangle to be cleared are set as (0,0) and (WIDTH, HEIGHT). The WIDTH and HEIGHT have the same value as the width an height of the canvas. You could just as easily only clear part of the canvas but we want to clear all of it.
function clear() {
  ctx.clearRect(0, 0, WIDTH, HEIGHT);
}
Next the drawaxes() function draws our x and y axes on the left and bottom edges of our canvas.
function drawaxes(){
  ctx.strokeStyle = "black";
  ctx.beginPath();
  /* y axis along the left edge of the canvas*/
  ctx.moveTo(0,0);
  ctx.lineTo(0,105);
  ctx.stroke();
  /* x axis along the bottom edge of the canvas*/
  ctx.moveTo(0,105);
  ctx.lineTo(180,105);
  ctx.stroke();
}
The strokestyle for the context is set to the color that we want the stroke method to be when we use it to draw our path.
ctx.strokeStyle = "black";
Then we start our new path with
ctx.beginPath();
Now we can draw our our y axis by creating the path for it and then using the stroke method to draw it.
  /* y axis along the left edge of the canvas*/
  ctx.moveTo(0,0);
  ctx.lineTo(0,105);
  ctx.stroke();
We do the same for the x axis
  /* x axis along the bottom edge of the canvas*/
  ctx.moveTo(0,105);
  ctx.lineTo(180,105);
  ctx.stroke();
The next step in our draw() function calls plotdata()
function plotdata(){
  ctx.strokeStyle = "black";
  ctx.beginPath();
  ctx.moveTo(0,HEIGHT-(temps[0]));
  j = 1;
  for (var i in temps){
    ctx.lineTo(j*30,HEIGHT-(temps[j]));
    ctx.stroke();
    j++;
  }
}
Again, the strokeStyle for the context is set and we start our new path
  ctx.strokeStyle = "black";
  ctx.beginPath();
We move to our starting point. Our y axis starts at the top and goes down but we want to represent our data as lowest at the bottom and highest at the top so we use this formula.
ctx.moveTo(0,HEIGHT-(temps[0]));
This effectively inverts our temperature value so that it is 80 pixels from the bottom instead of 80 pixels from the top.
Now we cycle through the rest of our temperatures and draw a line to each of them from the last one.
  j = 1;
  for (var i in temps){
    ctx.lineTo(j*30,HEIGHT-(temps[j]));
    ctx.stroke();
    j++;
  }
We use j * 30 so that each of our data points are spaced 30 pixels apart rather than being 7 pixels mashed together.
Here is the finished graph…
This is a very basic example to help make the concepts behind drawing on the canvas clear. In the next section we’ll start to make it more useful and add labels as well as move the xy origin further into the canvas.
Here is part 2 http://html5.litten.com/graphing-data-in-the-html5-canvas-element-part-ii/
Here is part 3 http://html5.litten.com/graphing-data-in-the-html5-canvas-element-part-iii/
Hi ,
I need a graph to be drawn on 3 axis using HTML5 and javascript…..
Please help..
Regards
Manish
need immediate help for the above problem ..
anyone pls help on this …